OUR WORK
It is a new world of hybrid workplaces, IoT, and a whole range of new metrics to measure. However, there are some things which will always remain. Data and how it is used to benchmark delivery performance is one of them. Yamro.Limited is all about supporting your business to utilize data to drive informed decision-making and create meaningful insights. Through this portfolio, you'll find samples of Yamro.Limited's work and expertise in business analytics, showcasing abilities to extract insights from complex data sets and provide valuable recommendations to drive business growth and success. Let's explore how we can work together to unlock the power of your data!
You want to check out samples?
Just click on the images to reach the PowerBi reports.
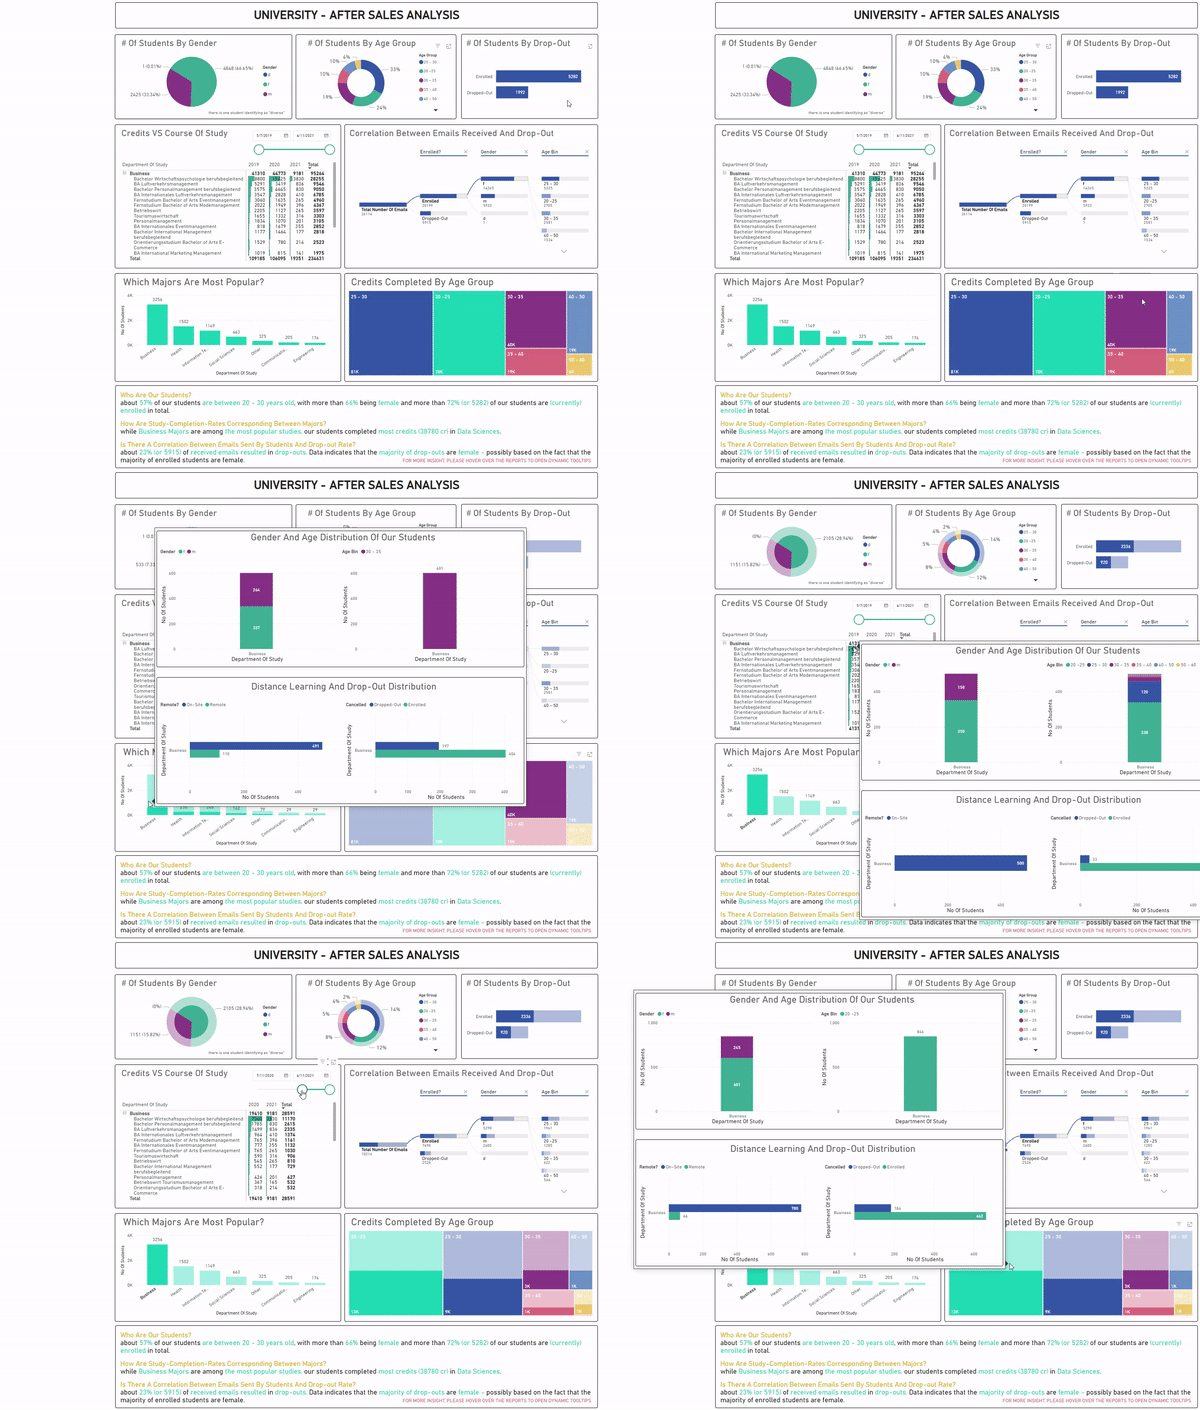
KPIs - Educational Institute
For an educational institution, our goal was to analyze the client's data and establish Key Performance Indicators (KPIs) to promote organic student base growth. We started by reviewing data on student progress, contact rates, and churn rates, identifying relevant trends. We then defined KPIs, including those related to program-specific study progress, age groups, gender, and email impact on churn. After conducting a comprehensive data analysis to address specific questions, we provided a detailed report with visualizations to communicate our findings effectively.
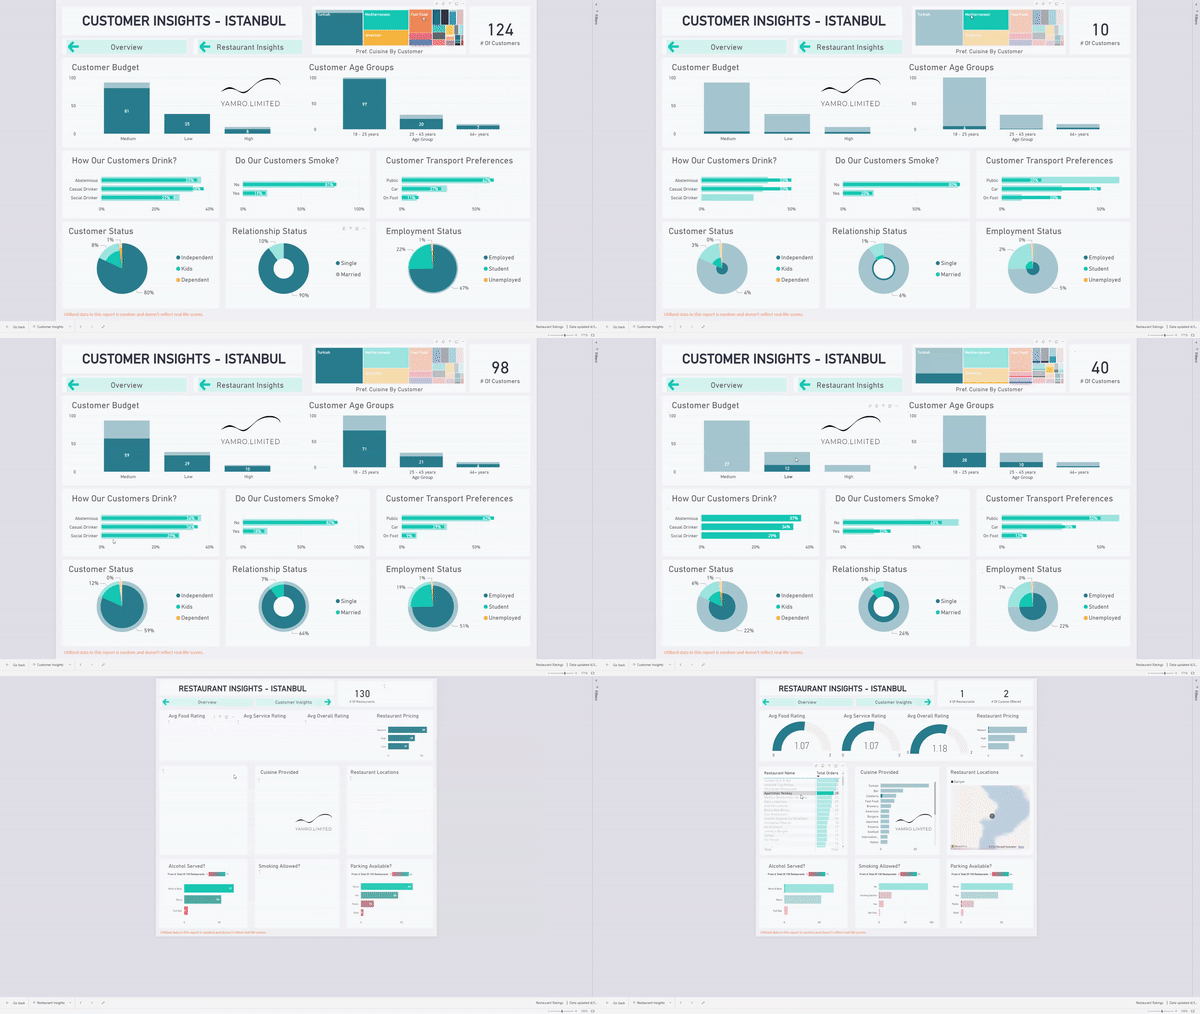
Market Research - Restaurants
For an investor, we conducted a market research study of the restaurant industry in Istanbul. We investigated data related to consumer preferences, market trends, and competitive landscape. The analysis includes details of popular cuisine types, restaurant locations, pricing strategies, and customer insights such as satisfaction levels, demographics, and drinking or smoking habits. The findings can be used by restaurant owners, decision-makers, and investors to improve their offerings, target new customers, and stay competitive in the market.
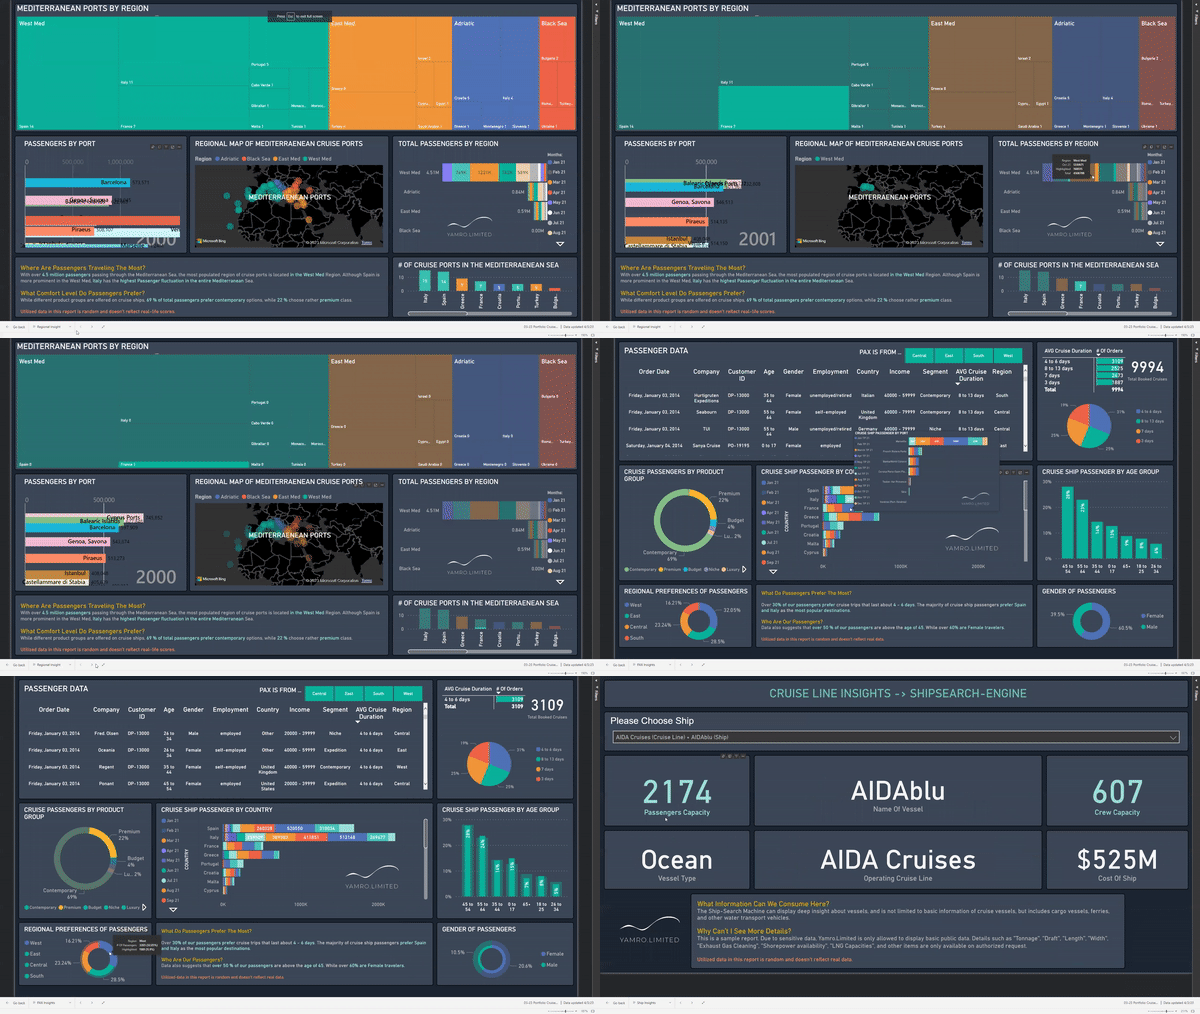
Cruise Ports & Passengers Insights
A client was looking to gain insights into cruise ports and their passengers; specifically analyzing data related to passenger volume, demographics, and port activity. The analysis identified top ports, popular destinations, passenger nationalities, and other items such as cruise line market share and even individual cruise port performance. The findings can be used by industry stakeholders to optimize operations, plan marketing strategies, and improve the overall passenger experience.
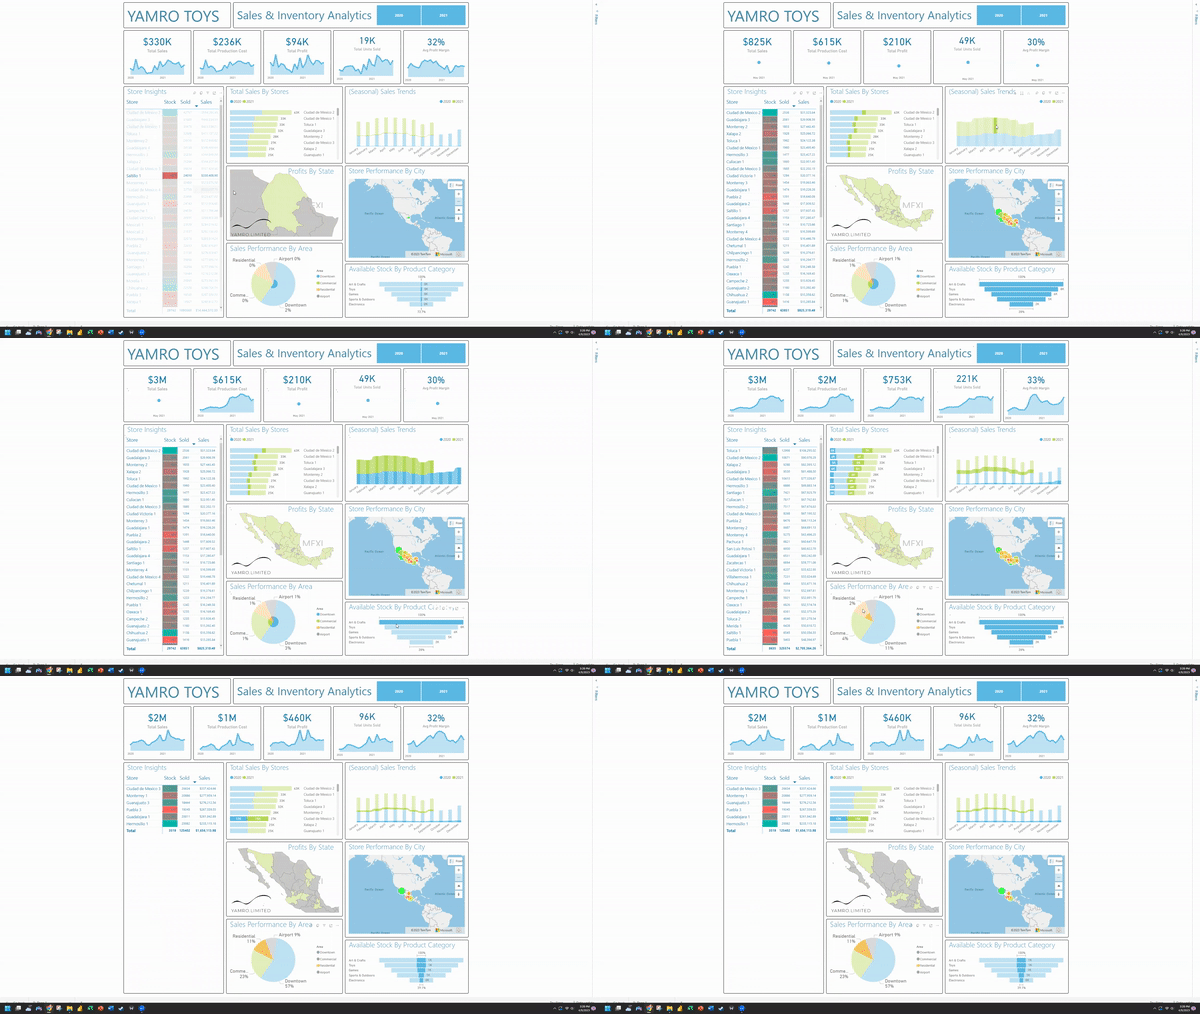
Regional Inventory & Sales Performance Details
In this project we analyzed regional data, providing insights into sales trends, inventory levels, and product performance for a client, operating stores in Mexico. We were able to address top-performing locations, product categories, sales & profits by state and region, as well as inventory turnover rates. We suggested our client can utilize this data to optimize their inventory management, improve sales strategies, and increase profitability while eventually driving growth and expanding in performing regions.


